Crypto Price Analysis & Overview June 12th: Bitcoin, Ethereum, Ripple, VeChain & Kyber Network

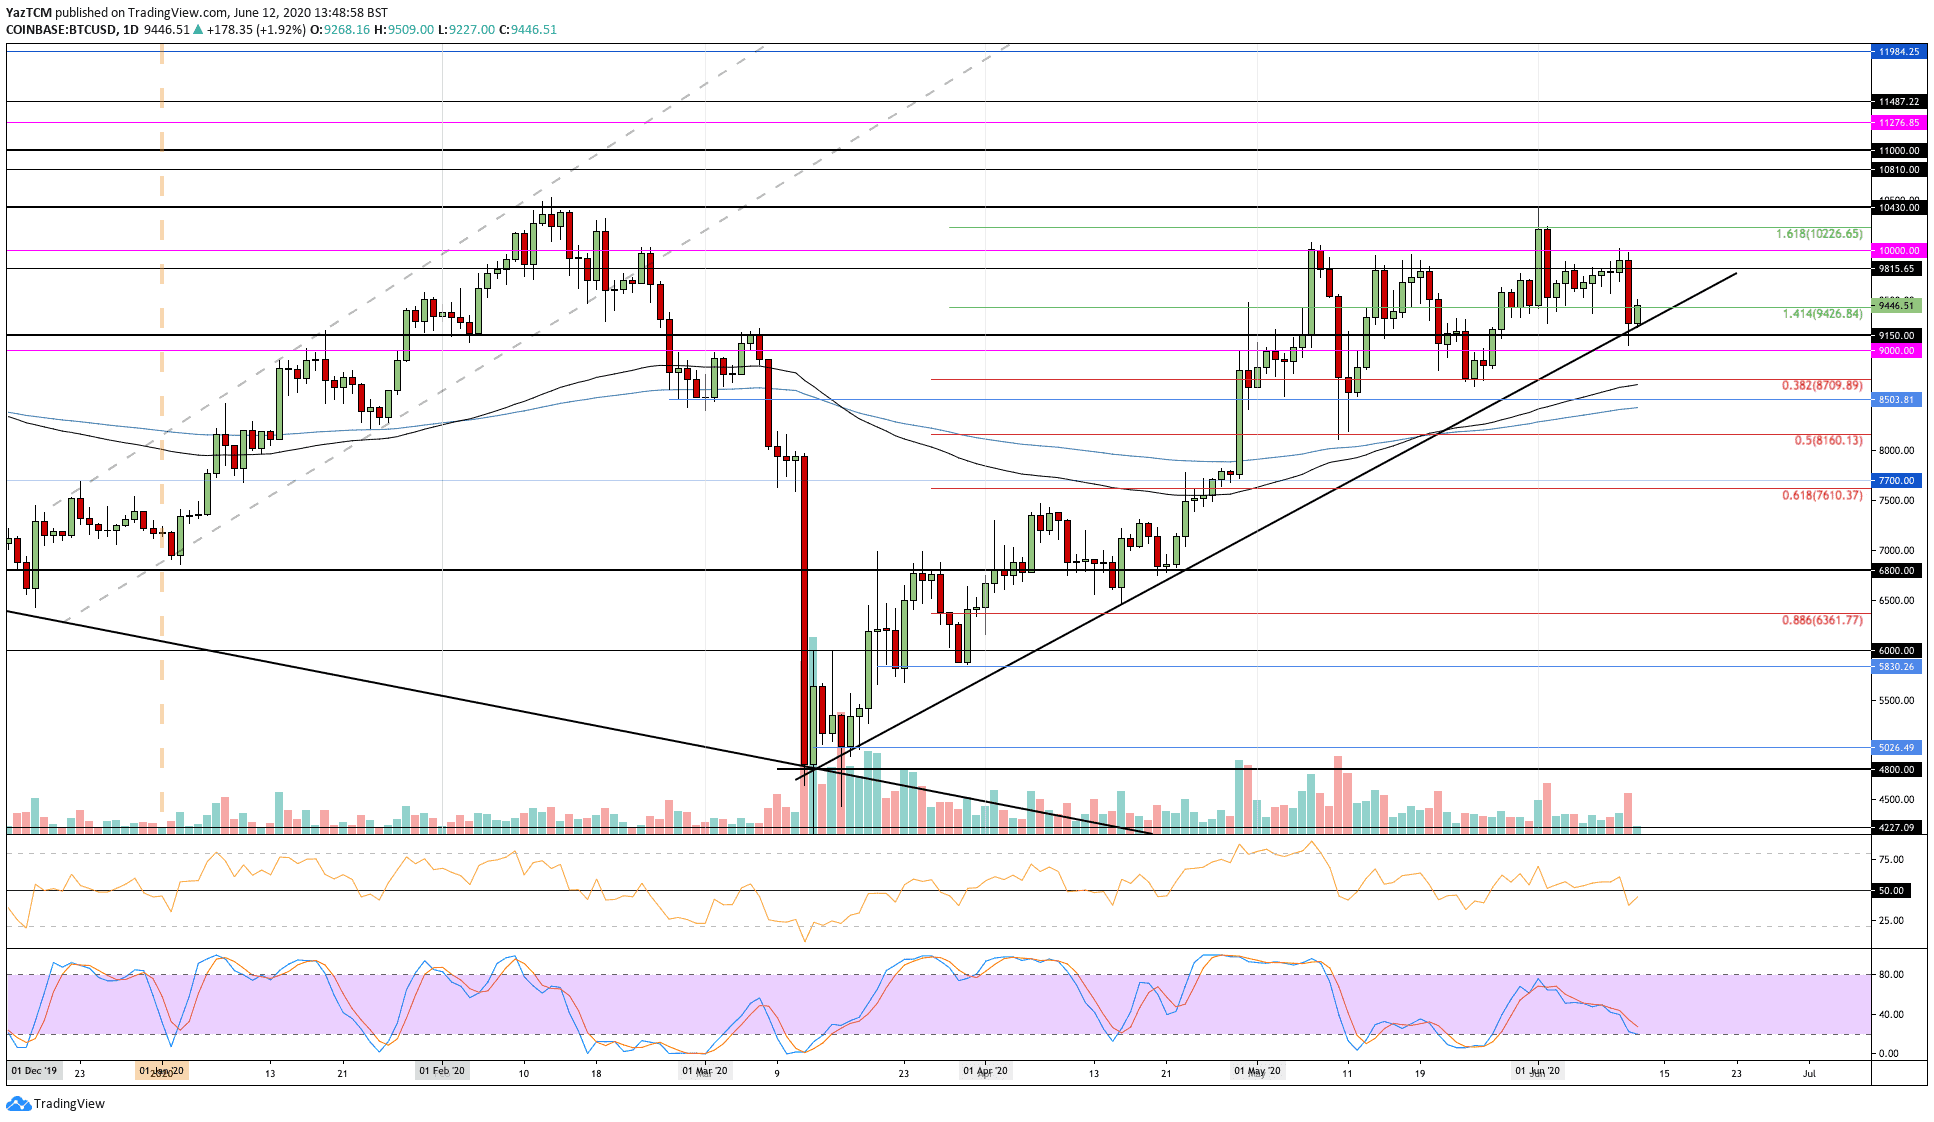
Bitcoin saw a 3% decrease over the last week of trading as it drops into the $9,445 level. The coin started the week battling the $9,815 level as it proceeded higher to reach $10,000. Unfortunately, BTC was unable to capitalize above $10,000 and dropped by a steep 7% yesterday.
Luckily, it found support at a rising trend line, which has kept the bullish trend intact for now.
Looking ahead, if the buyers push higher, resistance lies at $9,815 and $10,000. Above this, added resistance is expected at $10,226 and $10,430.
On the other side, if the sellers break beneath the rising trend line, support is located at $9,150, $9,000, and $8,700 (.382 Fib Retracement).
Ethereum
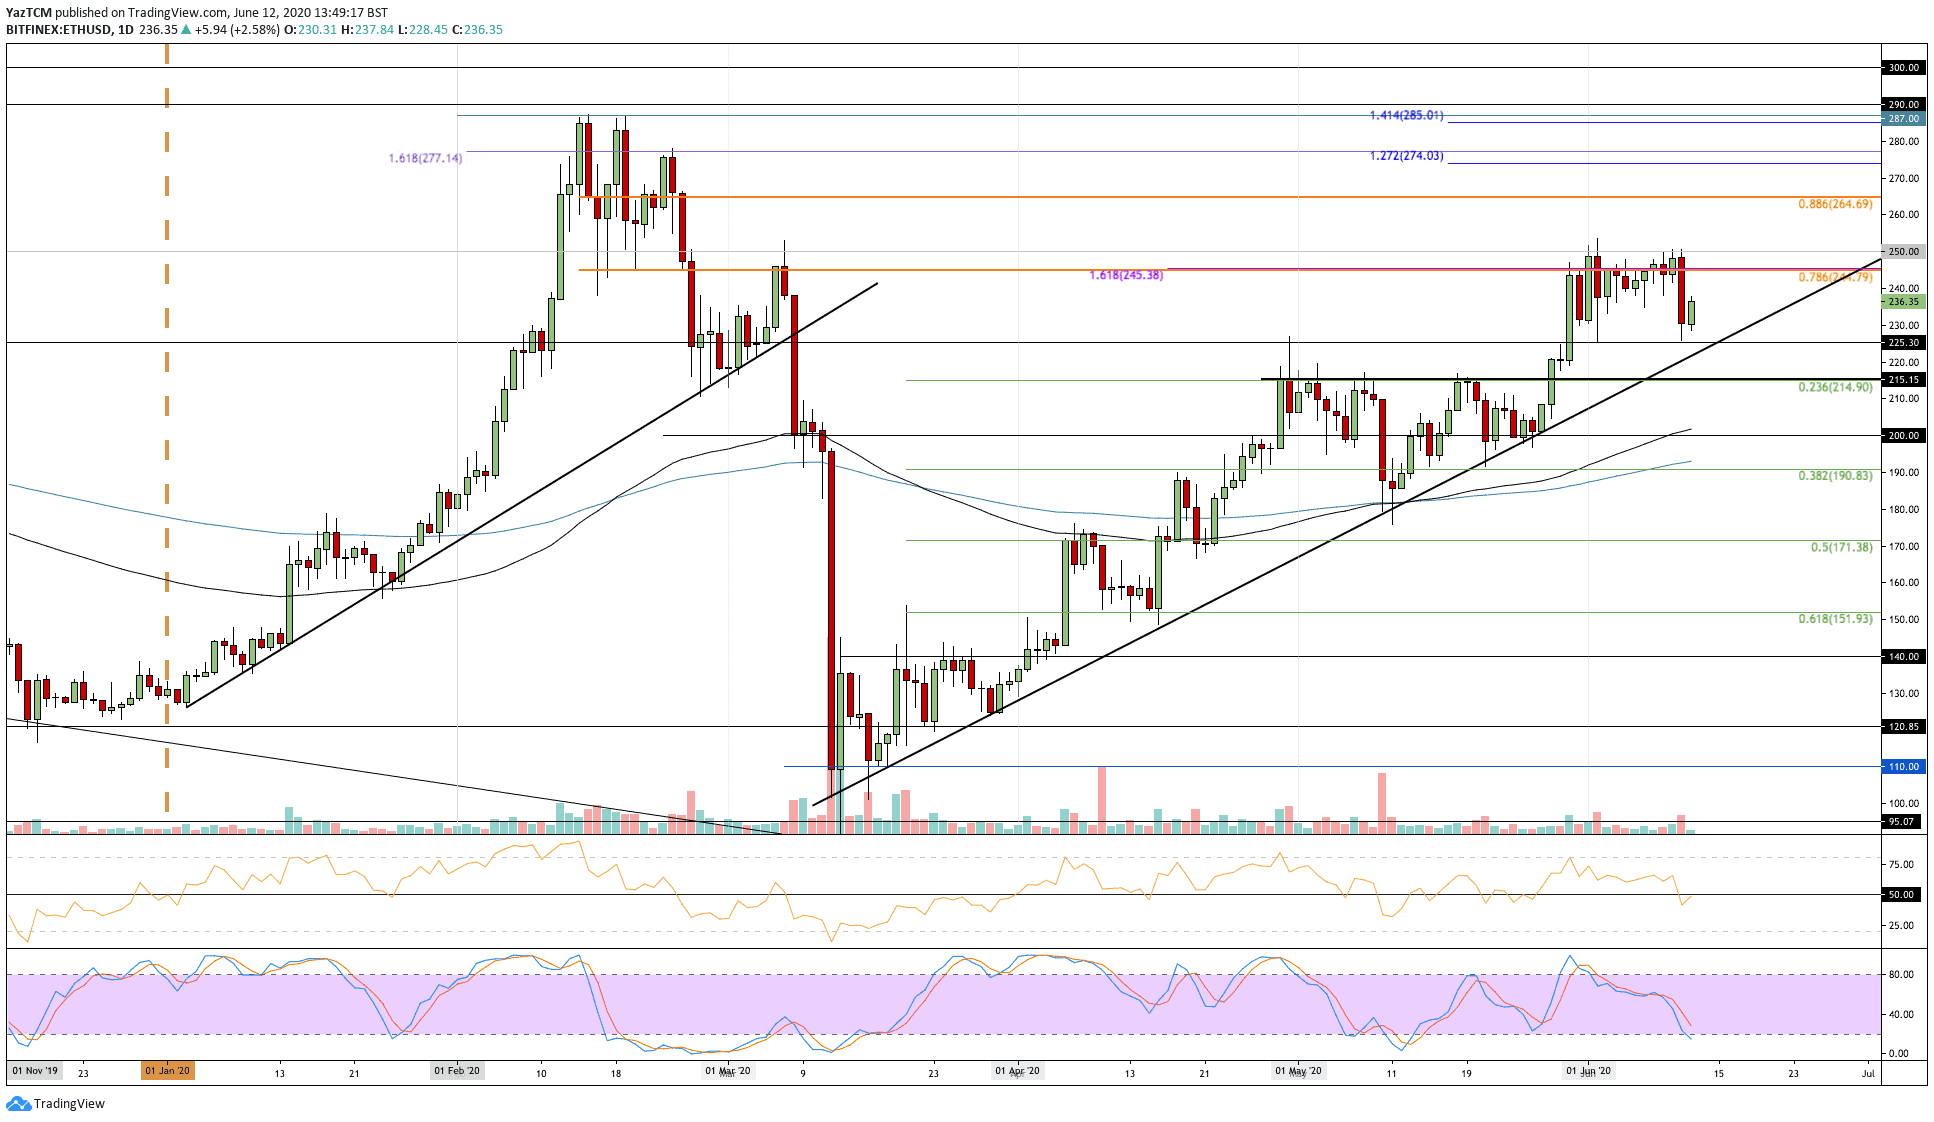
Ethereum decreased by 2.5% over the past week. ETH was trading at $240 at the start of the week as it made a push higher toward $250. It failed to break above $250, which caused ETH to roll over and fall into the $225 support yesterday.
Looking ahead, if the buyers push higher, resistance lies at $245 and $250. Above $250, added resistance lies at $265 (bearish .886 Fib Retracement).
Alternatively, if the sellers push lower, the first level of support is expected at $225. Beneath this, support is found at $215 and $200.
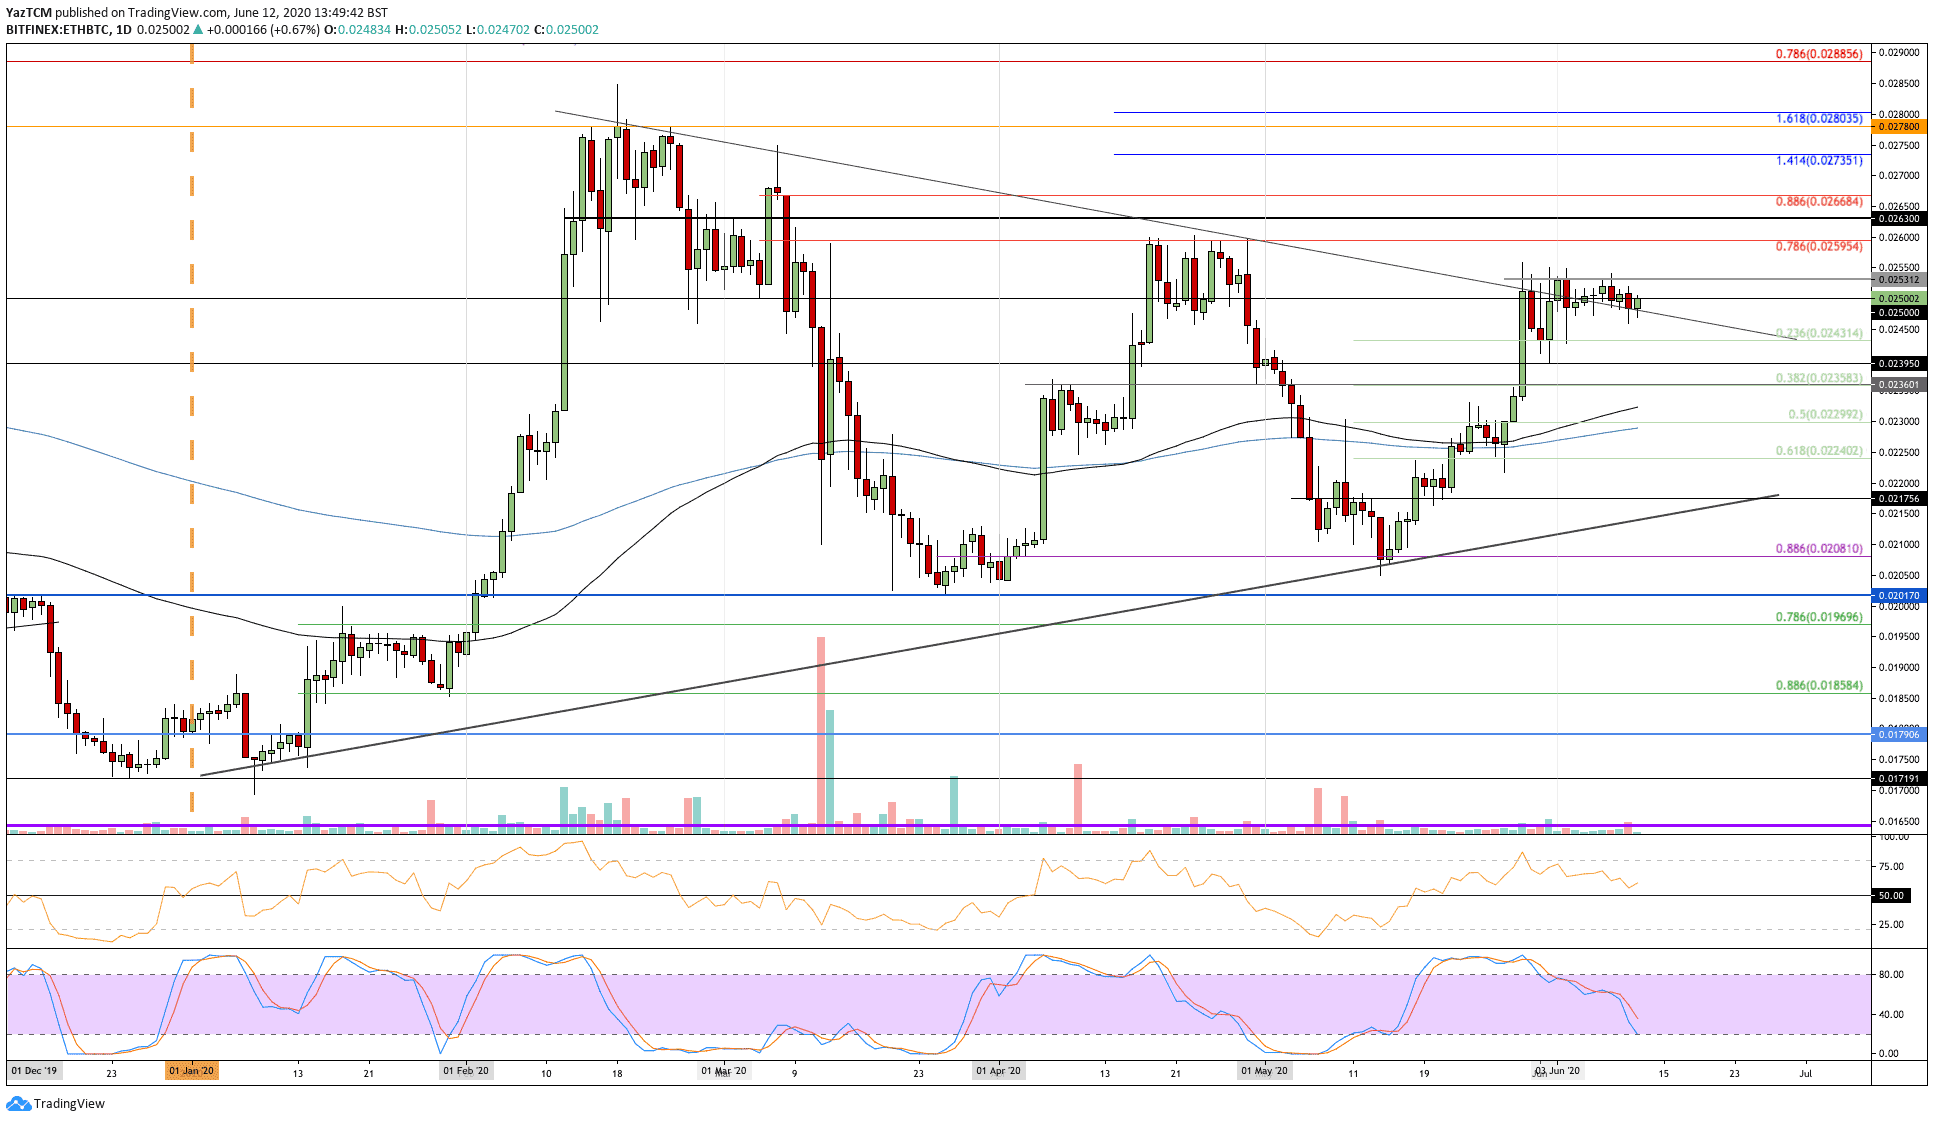
Against Bitcoin, ETH struggles to break the 0.0253 BTC resistance level. The coin slipped lower from here as it now trades at 0.025 BTC.
Moving forward, the first level of resistance is located at 0.0253 BTC. Above this, added resistance lies at 0.026 BTC (bearish .786 Fib Retracement) and 0.0263 BTC.
Alternatively, if the sellers push beneath 0.025 BTC, support can be found at 0.0243 BTC (.236 Fib Retracement), 0.0239 BTC, and 0.0235 BTC (.382 Fib Retracement).
Ripple
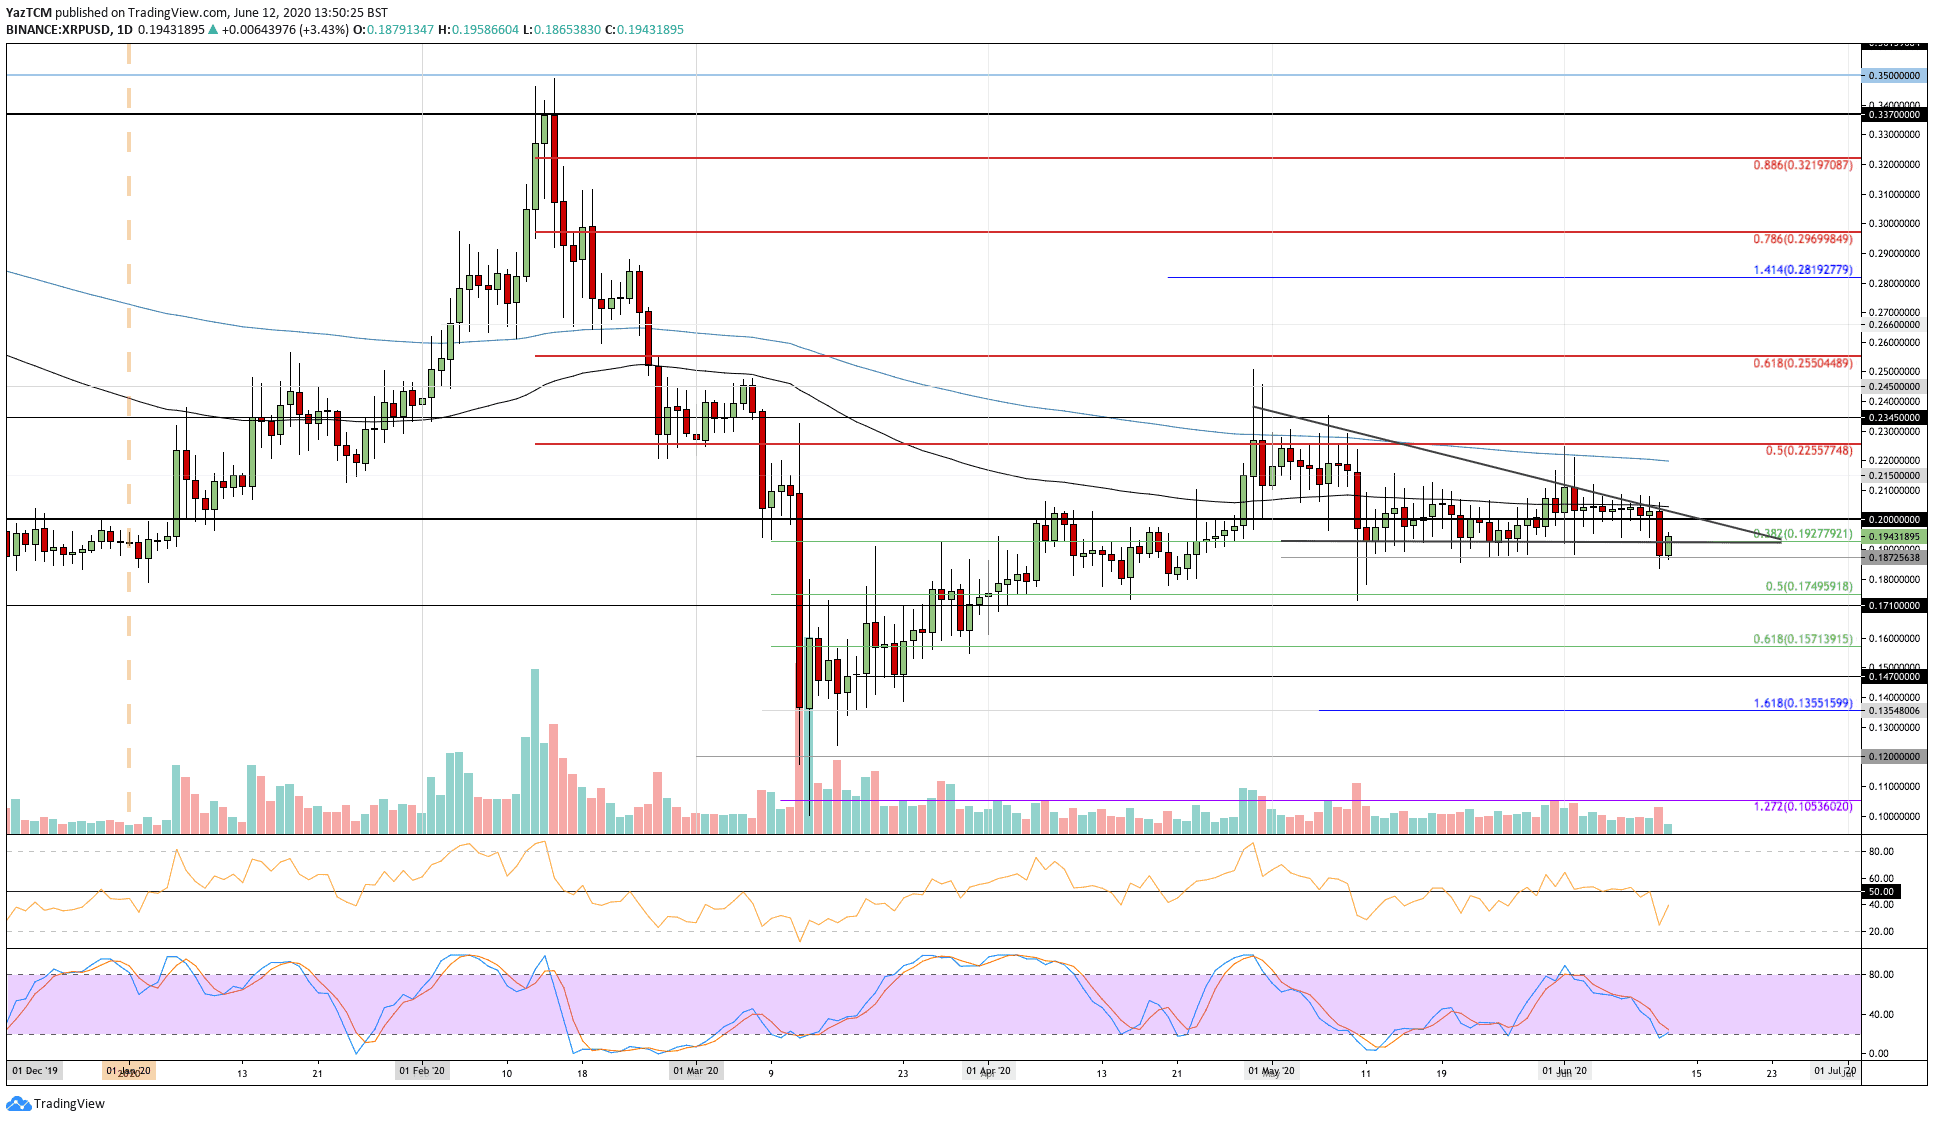
XRP fell by a total of 4% this week as the cryptocurrency drops beneath the descending triangle pattern after beaking beneath the $0.192 support. It had been struggling to break above the 100-days EMA and the upper boundary of the triangle for the entire period of June, which caused it to break beneath the triangle yesterday.
XRP did manage to find strong support at $0.187 and has re-entered the triangle.
Looking ahead, if the sellers push back beneath $0.192, support is located at $0.187. Beneath this, support is found at $0.0175 (.5 Fib Retracement) and $0.0171.
Alternatively, if the buyers push higher, the first level of resistance lies at $0.2. Above this, resistance lies at $0.206 (100-day EMA) and $0.215.
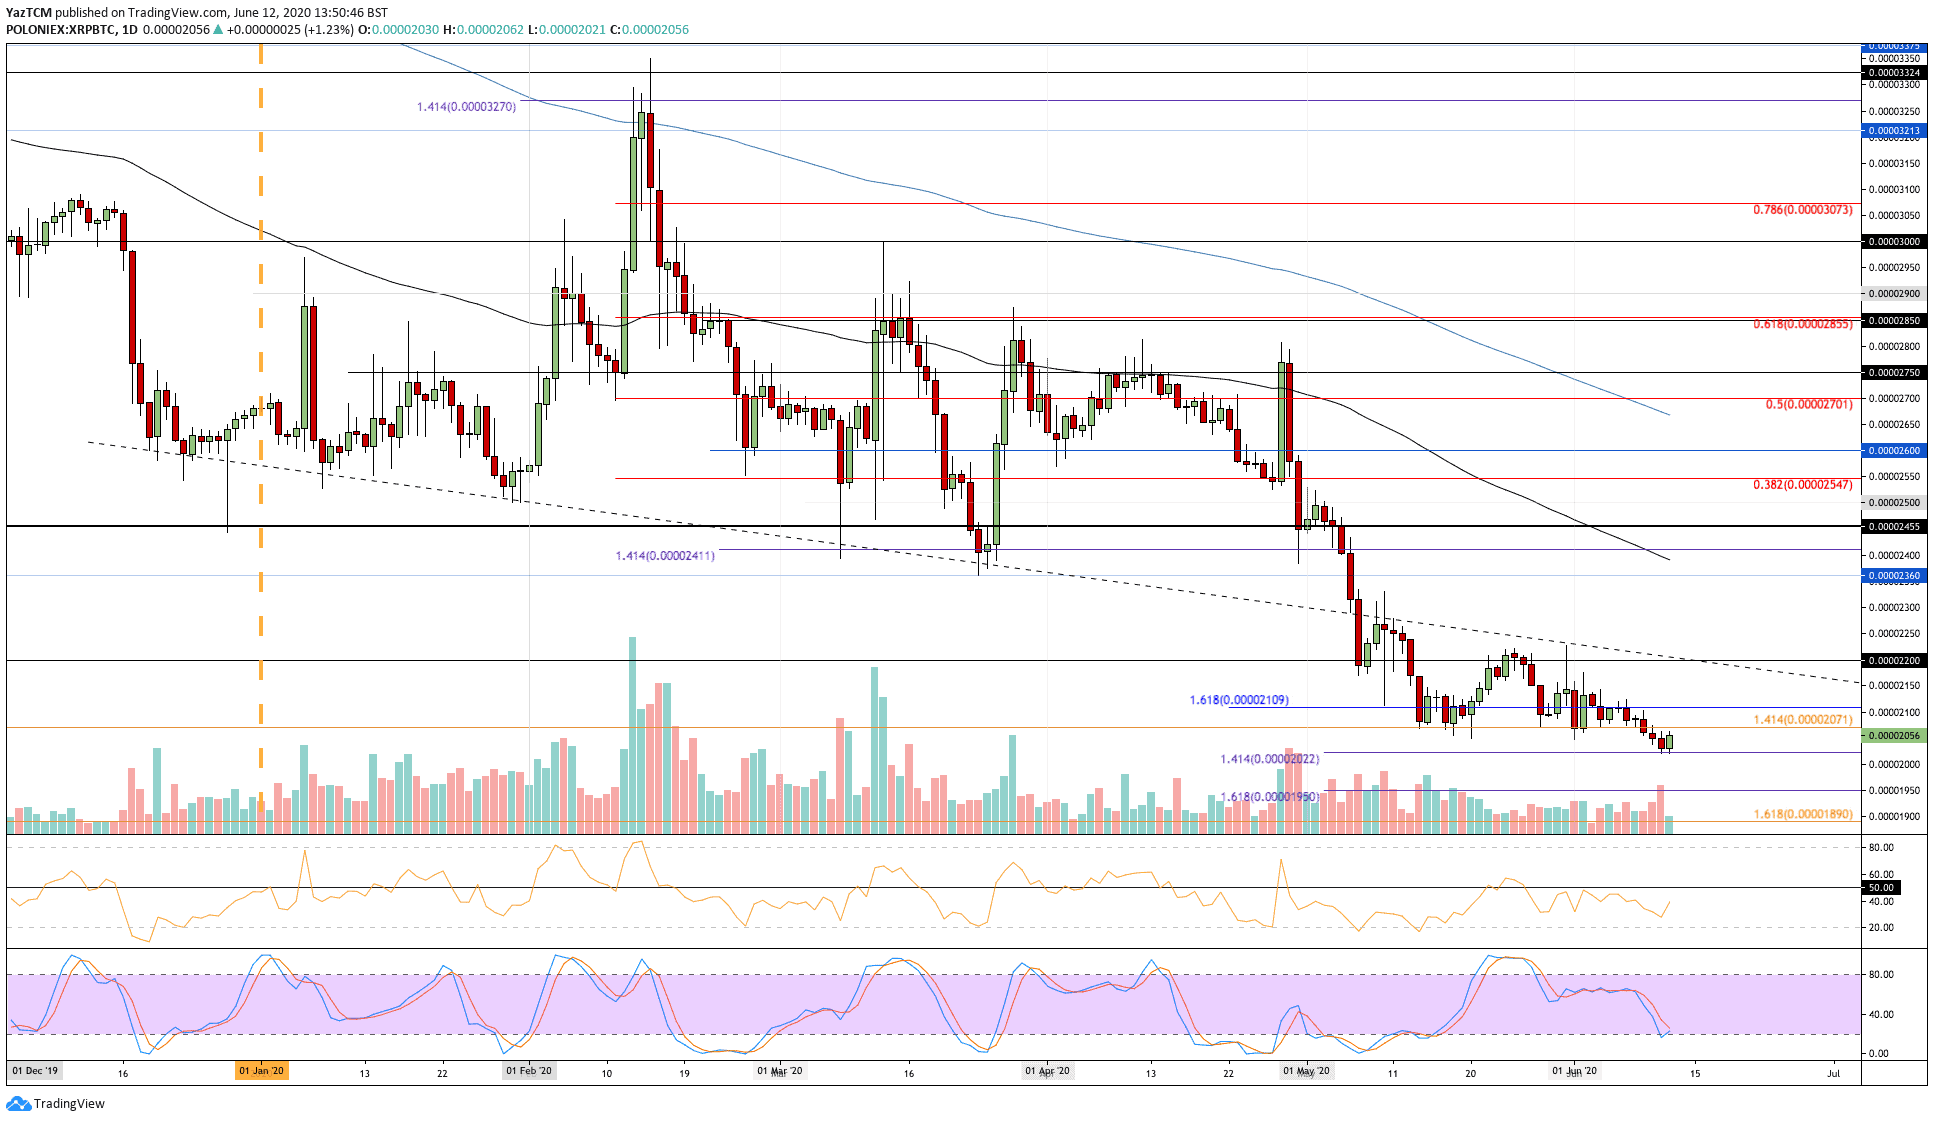
Against Bitcoin, XRP created a new 2-year low price at 2022 SAT yesterday. The coin had been battling to remain above 2071 SAT since mid-May. However, it failed to hold the support this week as XRP set fresh lows.
If the sellers continue beneath 2022 SAT, support can be expected at 2000 SAT, 1950 SAT, and 1890 SAT.
On the other side, resistance lies at 2071 SAT, 2100 SAT, and 2200 SAT.
VeChain
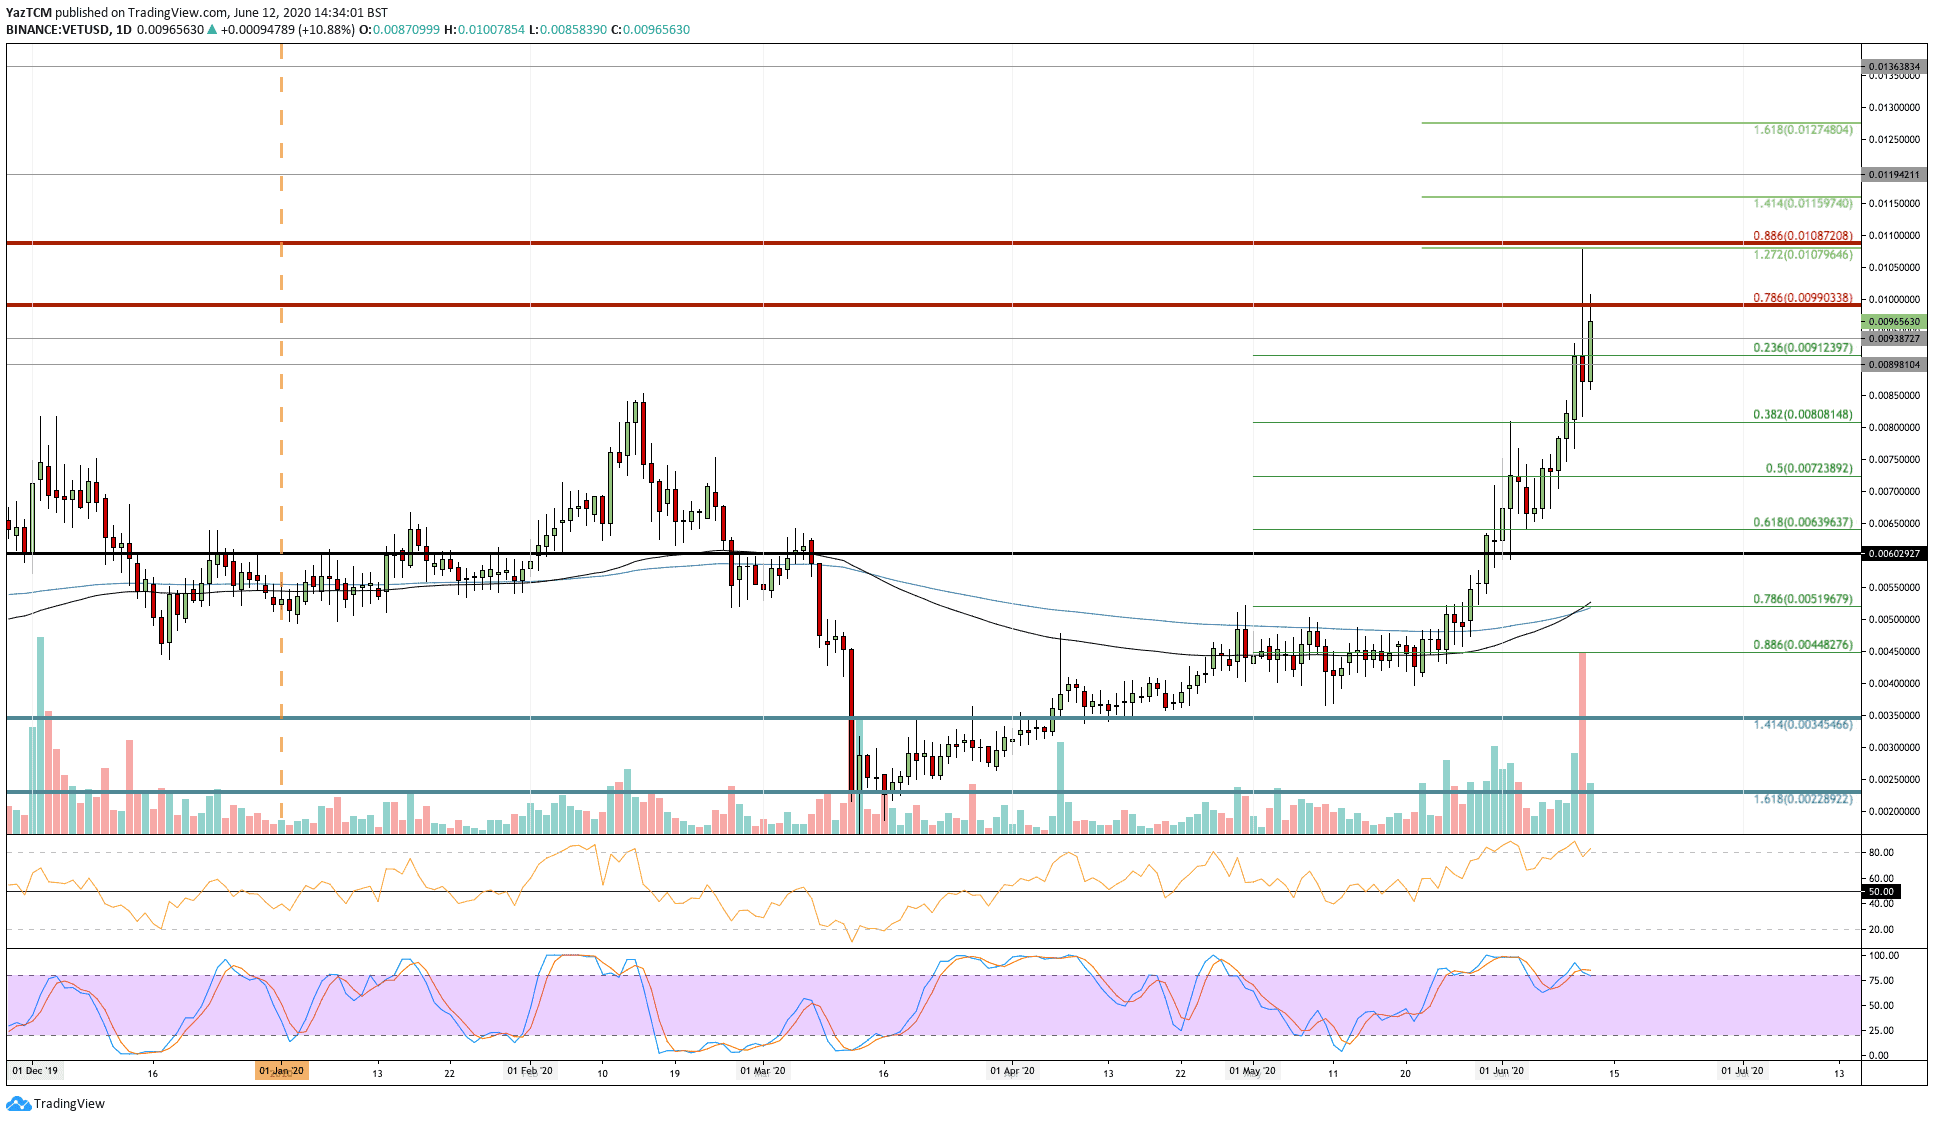
VET saw a very impressive 40% price surge over the last week of trading as the coin trades at a price of around $0.0096. The cryptocurrency started the week as low as $0.007 and started to climb higher. It quickly went on to create a fresh 2020 high above $0.0089 and went on to reach as high as $0.0107, where it ran into resistance at a 1.272 FIb Extension level.
Looking ahead, if the buyers push higher, resistance can be found at $0.0099 (bearish .786 Fib Retracement), $0.0107, and $0.0115 (1.414 Fib Extension level).
On the other side, if the sellers push lower, the first level of strong support lies at $0.0091 (.236 Fib Retracement). Added support then lies at $0.0085 and $0.008 (.382 Fib Retracement).
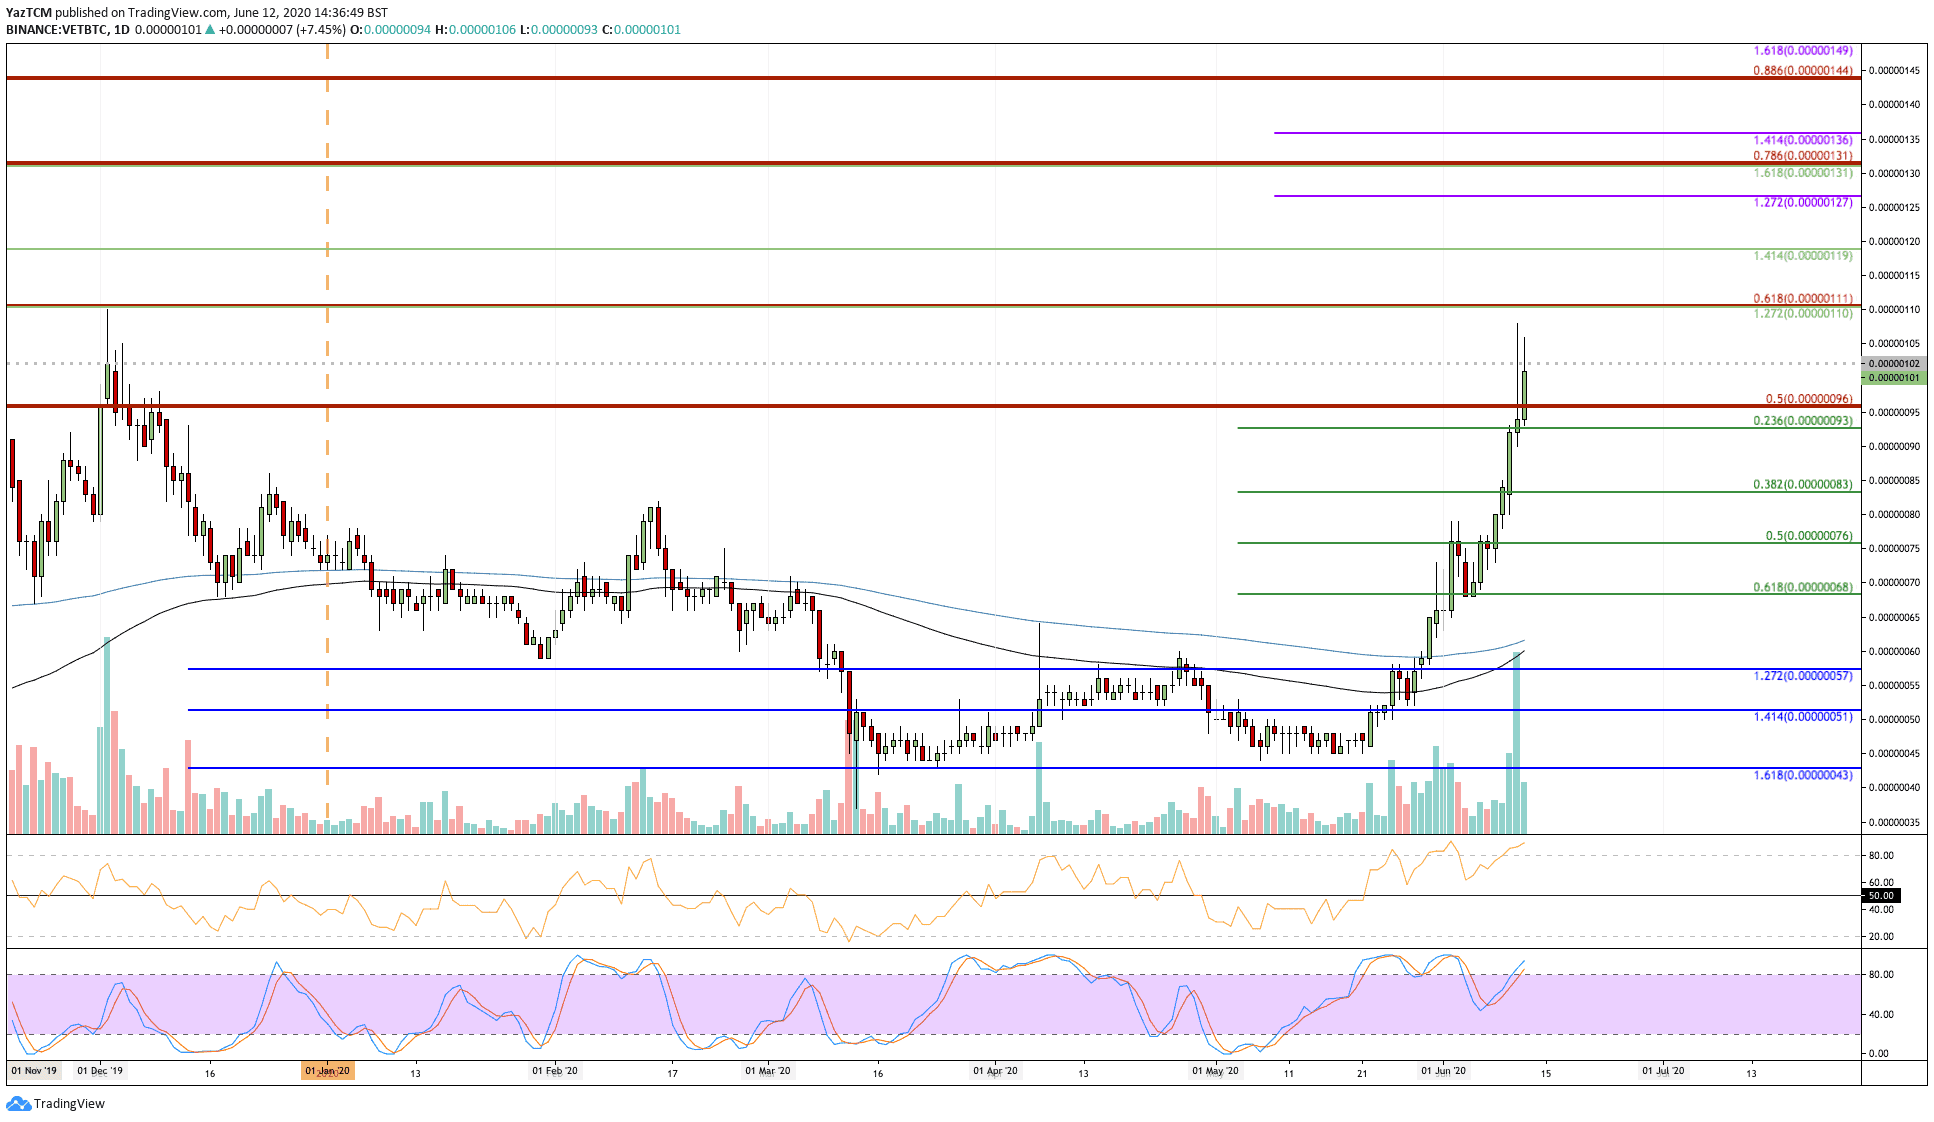
VET has also been on a rampage against Bitcoin as it surges to the 100 SAT level to create a fresh 2020 high as well. The coin had started the week at around 70 SAT before it began to surge higher to create a new 2020 high.
If the buyers continue above 102 SAT, resistance is expected at 111 SAT (bearish .618 Fib Retracement), 119 SAT (1.414 Fib Extension), and 131 SAT (bearish .786 Fib Retracement).
On the other side, the first level of support lies at 93 SAT. Beneath this, support can be found at 83 SAT, 80 SAT, and 76 SAT.
Kyber Network
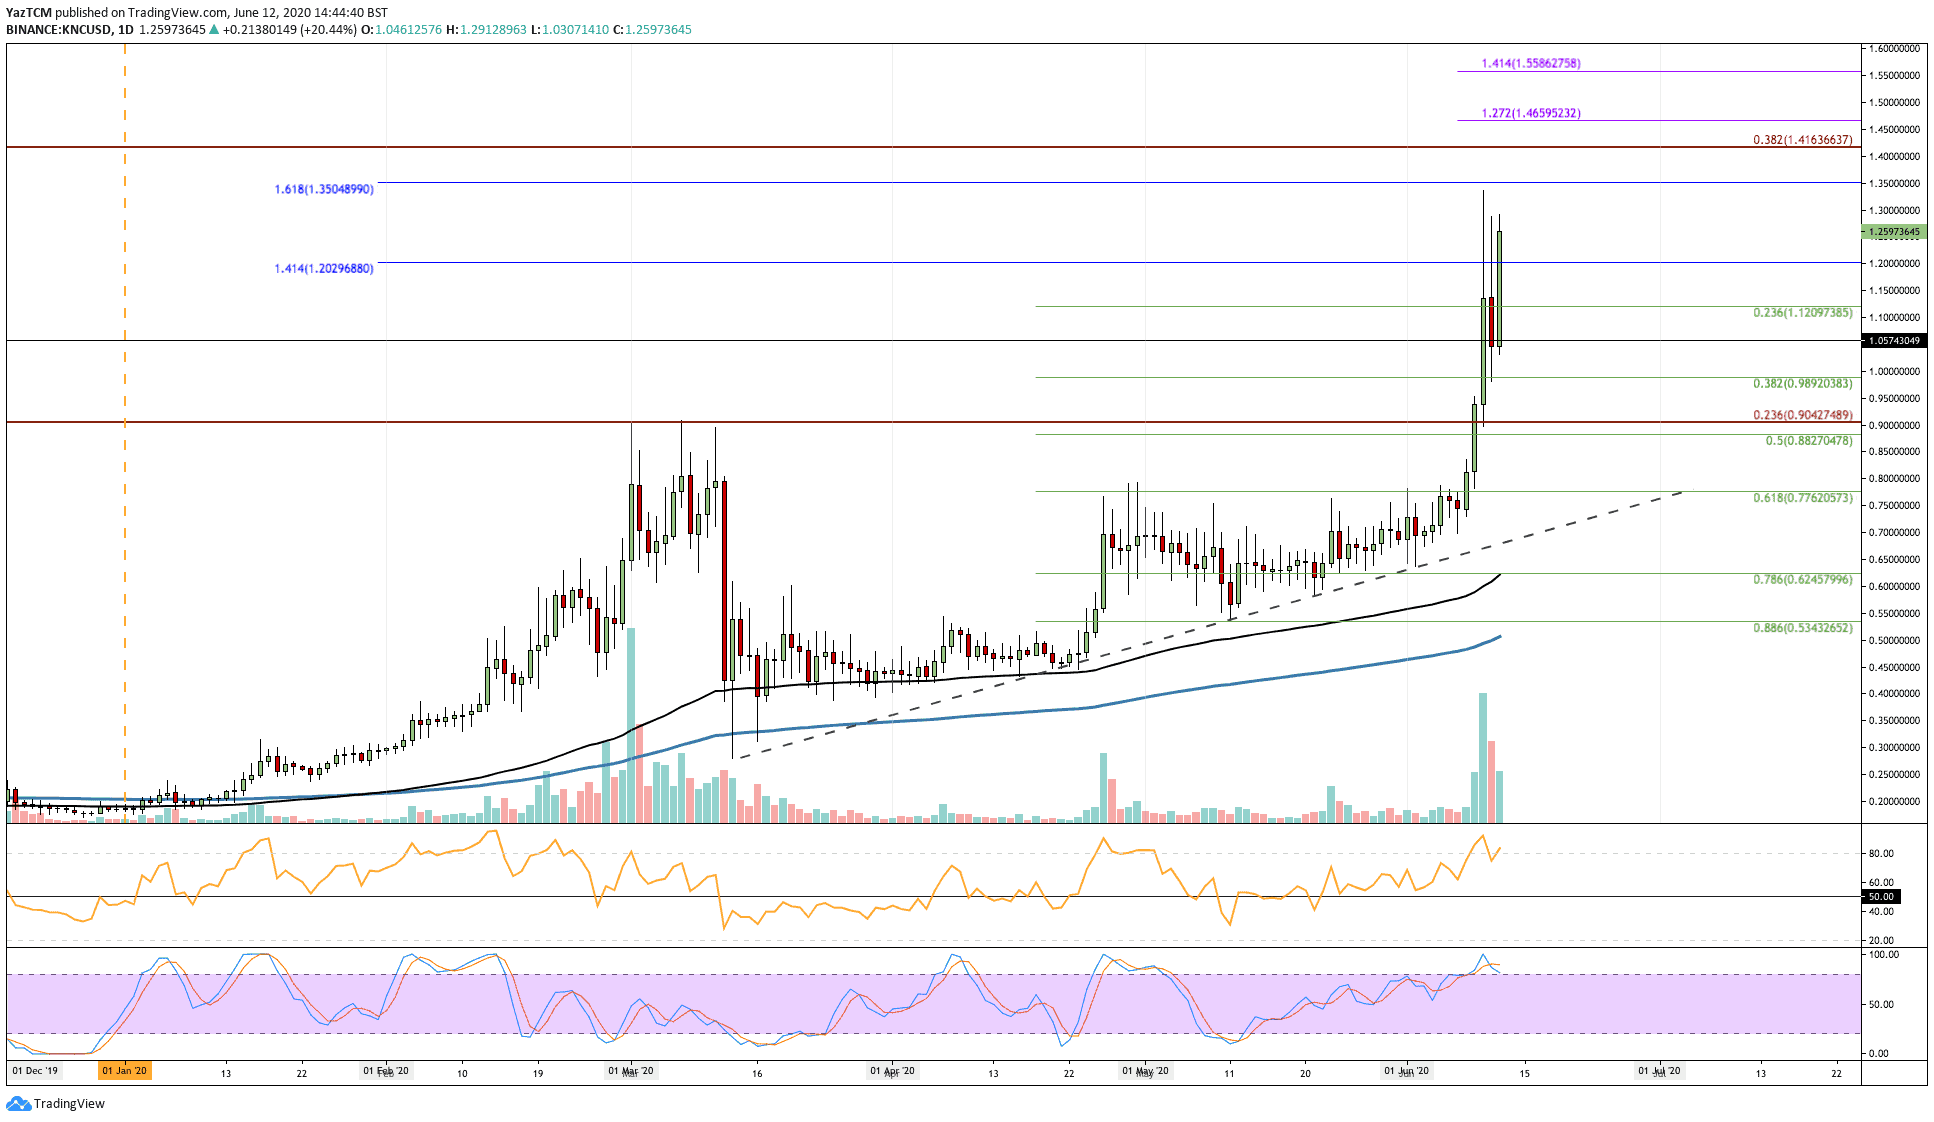
KNC saw a sizeable 69% price explosion this week as it reaches the $1.25 trading level. The cryptocurrency started the week by trading beneath $0.77 before starting its climb higher. During the push, KNC quickly broke above the 2020 high at $0.90 and went higher to reach as high as $1.30 before falling to $1.25.
Moving forward, if the buyers break above $1.30 again, resistance can be found at $1.35, $1.41 (bearish .382 Fib Retracement), and $146 (1.272 Fib Extension).
On the other side, if the sellers push lower, support is located at $1.20, $1.12, and $0.98 (.382 Fib Retracement).
Against Bitcoin, KNC also exploded higher this week as it reaches the 13,570 SAT level. The coin was previously trading within a symmetrical triangle and went on to break this pattern at the start of the week. It went on to break the 2020 high at 11,000 SAT and reached the 13,570 SAT resistance.
Looking ahead, if the buyers push above 14,000 SAT, resistance can be found at 14,820 SAT (1.414 Fib Extension), 15,400 SAT (bearish .382 Fib Retracement), and 16,610 SAT (1.618 Fib Extension).
Alternatively, if the sellers push lower, the first level of support lies at 11,900 SAT (.236 Fib Retracement). Beneath this, support lies at 10,880 SAT (.382 Fib Retracement) and 10,000 SAT.