Bitcoin Price Analysis: After Losing $1000 Yesterday, Is Mid-March Crash Starting All Over Again?
Recap of June 11, 2020: Bitcoin price touched nearly $10K as the daily high, and just a few hours later, the price plunged to almost $9K ($9078 on Bitstamp) as the daily low.
In our previous price analysis reports from the past days, we anticipated a huge move. This is from yesterday’s analysis: “Bitcoin’s mid-term symmetrical triangle is coming to its apex, and a decision is soon to be made.”
As Bitcoin couldn’t breach the $10,000 for maybe the sixth attempt since May 7, and together with the collapsing prices of the global markets – as Wall Street major indices dropped 5-6% on average on Thursday – the panic came to Bitcoin as well.
Wall Street didn’t see daily declines of over 3% since March 2020. Following the day with the highest number of new cases of COVID-19 ever on June 10, 2020, is the world starting to consider a second wave of the pandemic?
Decoupling: Not Anymore
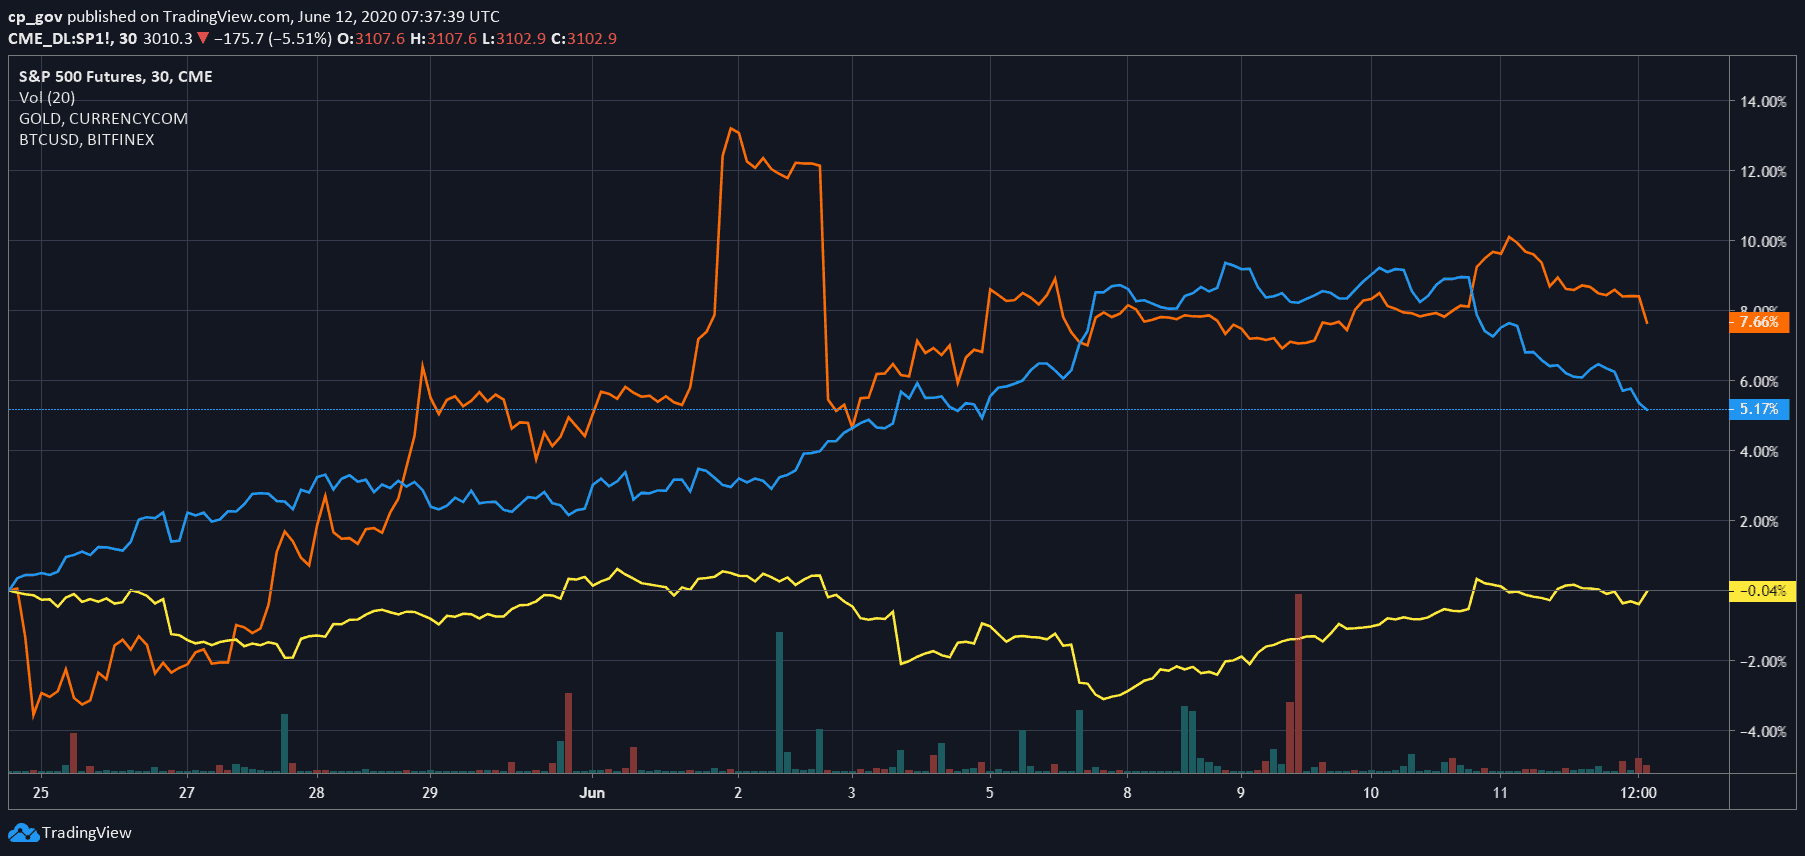
While the controversy about whether Bitcoin is a safe-haven asset was popular during the first days of the COVID-19 financial crisis during March, Bitcoin bulls were happy to see it decouple from the global markets.
However, following the severe collapse yesterday, Bitcoin behaved exactly like the S&P 500 and NASDAQ. It will be interesting to see if this kind of correlation will continue.
Unlike Bitcoin, Gold was preserving its value and didn’t drop yesterday as the markets crashed.

The Micro-level: Support and Resistance Levels To Watch
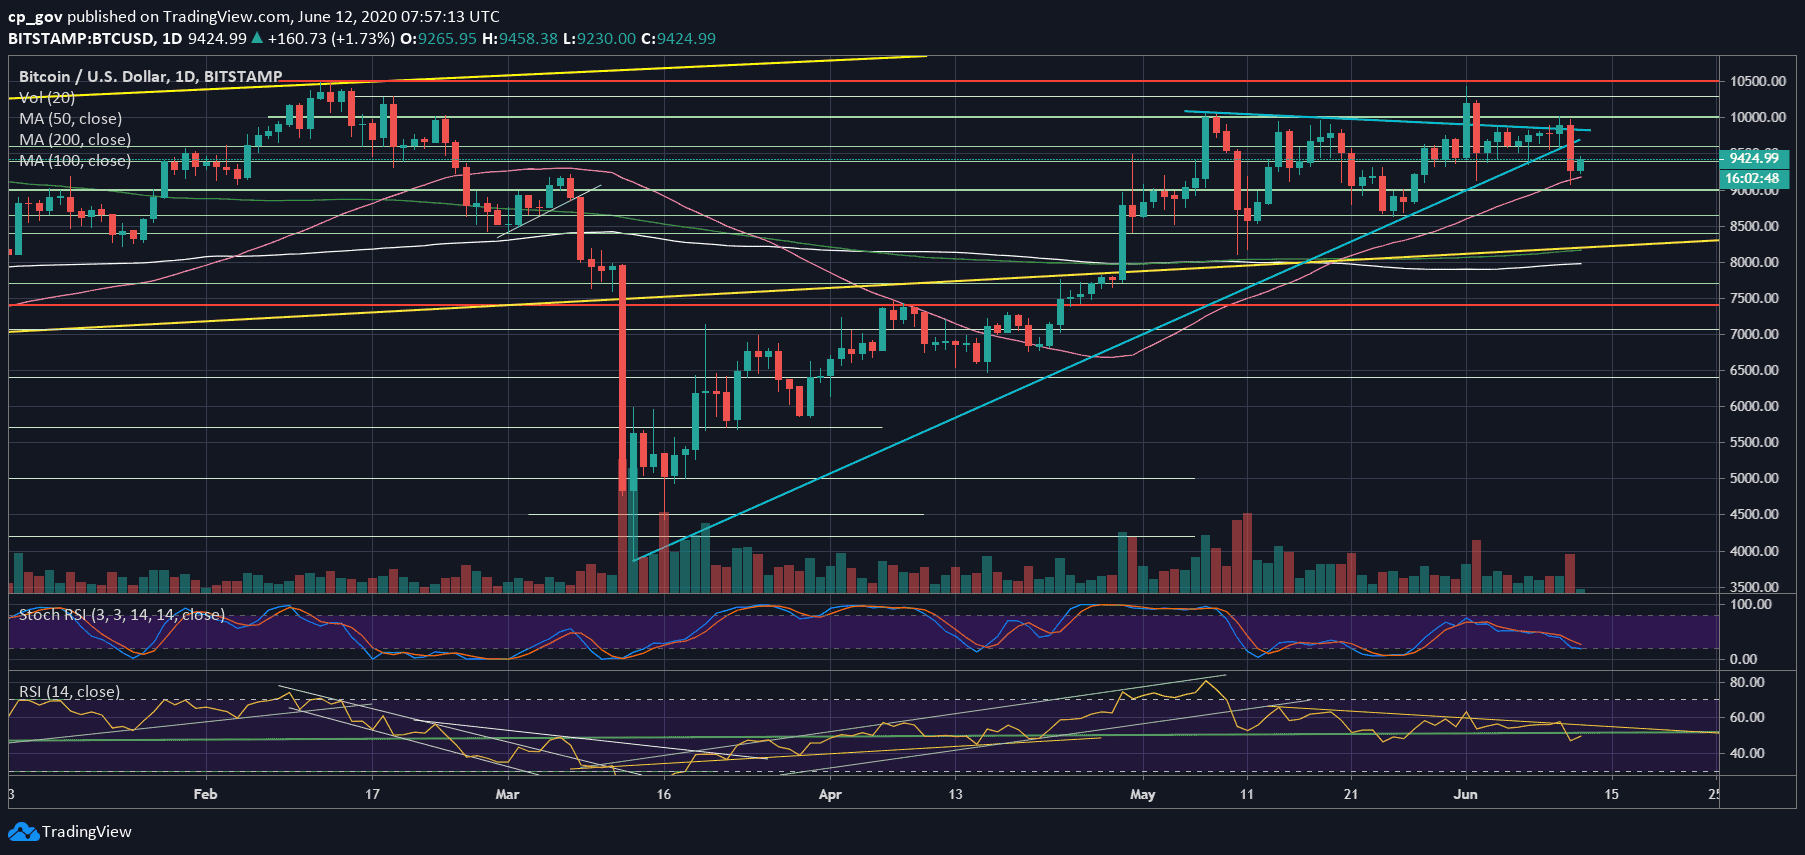
As can be seen on the following daily chart, once the symmetrical triangle broke down at around $9650, the bears arrived and crashed the price to $9000.
As of writing these lines, Bitcoin is trading around $9400 support turned resistance level. In case of a breakup, then the $9500 – $9600 is the first level of resistance, including the blue descending trend-line on the following 4-hour chart. This is followed by $9800 and the descending trend-line of the triangle (marked blue on the following 1-day chart).
From below, in case of a breakdown of the $9400, then the next support level lies around $9200 (the 50-days moving average line lies at $9170) and $9K, which was yesterday’s low, followed by $8800.
The RSI lost the critical 50 area, and now found temporary support at the 46 zone. The trading volume was huge – the highest levels since June 2.
Total Market Cap: $268 billion
Bitcoin Market Cap: $174 billion
BTC Dominance Index: 64.8%
*Data by CoinGecko
